


 41 / 76

SUSTAINABILITY REPORT 2017
39
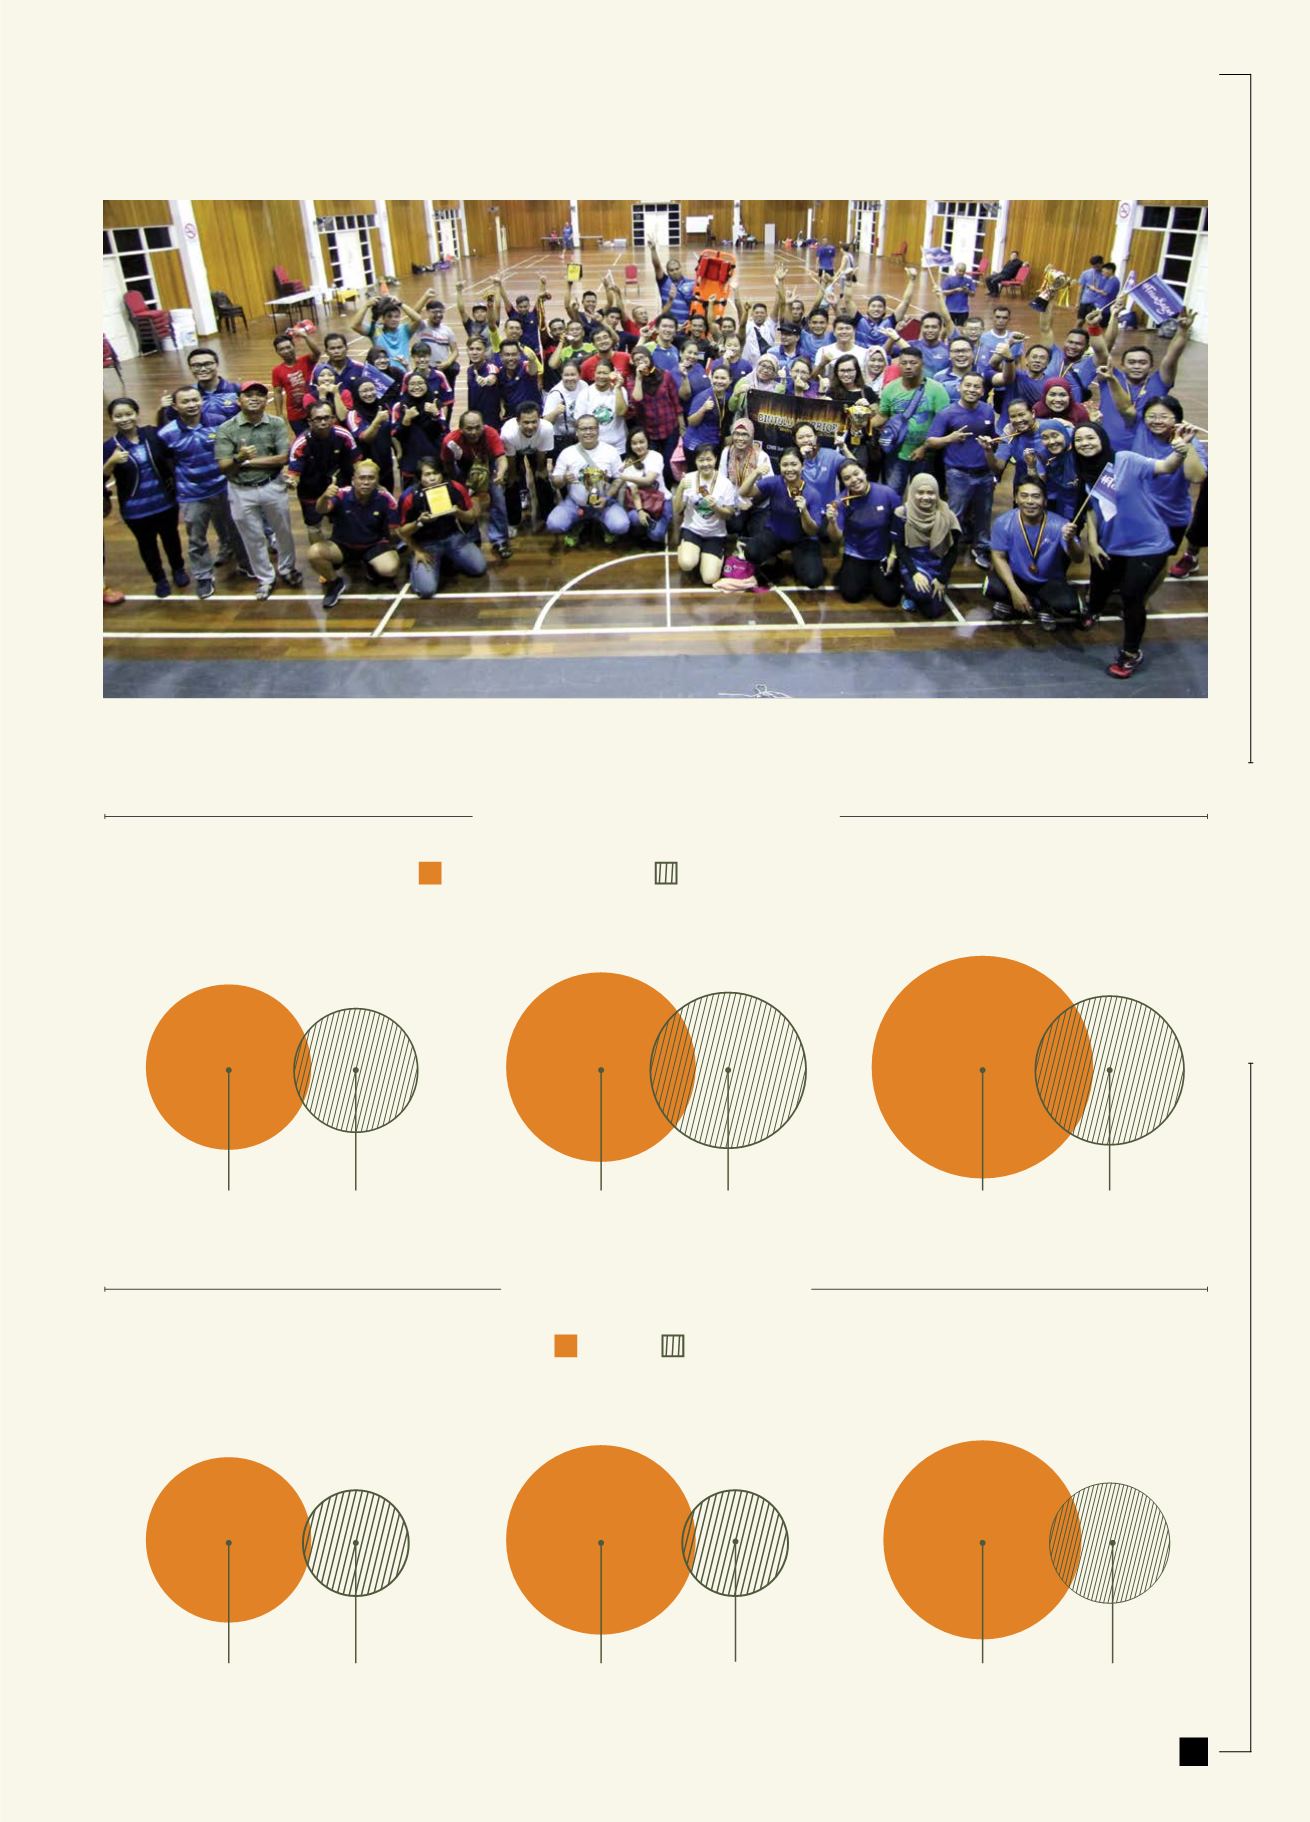
Workforce by Employment Type
The following charts highlight the diversified workforce at CMS:
2015
2016
2017
1,356 1,008
1,377
1,436
1,133
1,228
Permanent Employees
Non-Permanent Employees
Workforce by Gender
2015
2016
2017
1,911 453
2,023
2,117
457
547
Male
Female
Social: Labour Practices and Decent Work