


 36 / 62

www.cmsb
.com.myCahya Mata
Sarawak
Berhad
32
Local Hiring
As we are committed to the development of the local
infrastructure and economy of Sarawak in all aspects,
employing Sarawakians continues to be a priority in the
Group’s employment drive. This endeavour is evident
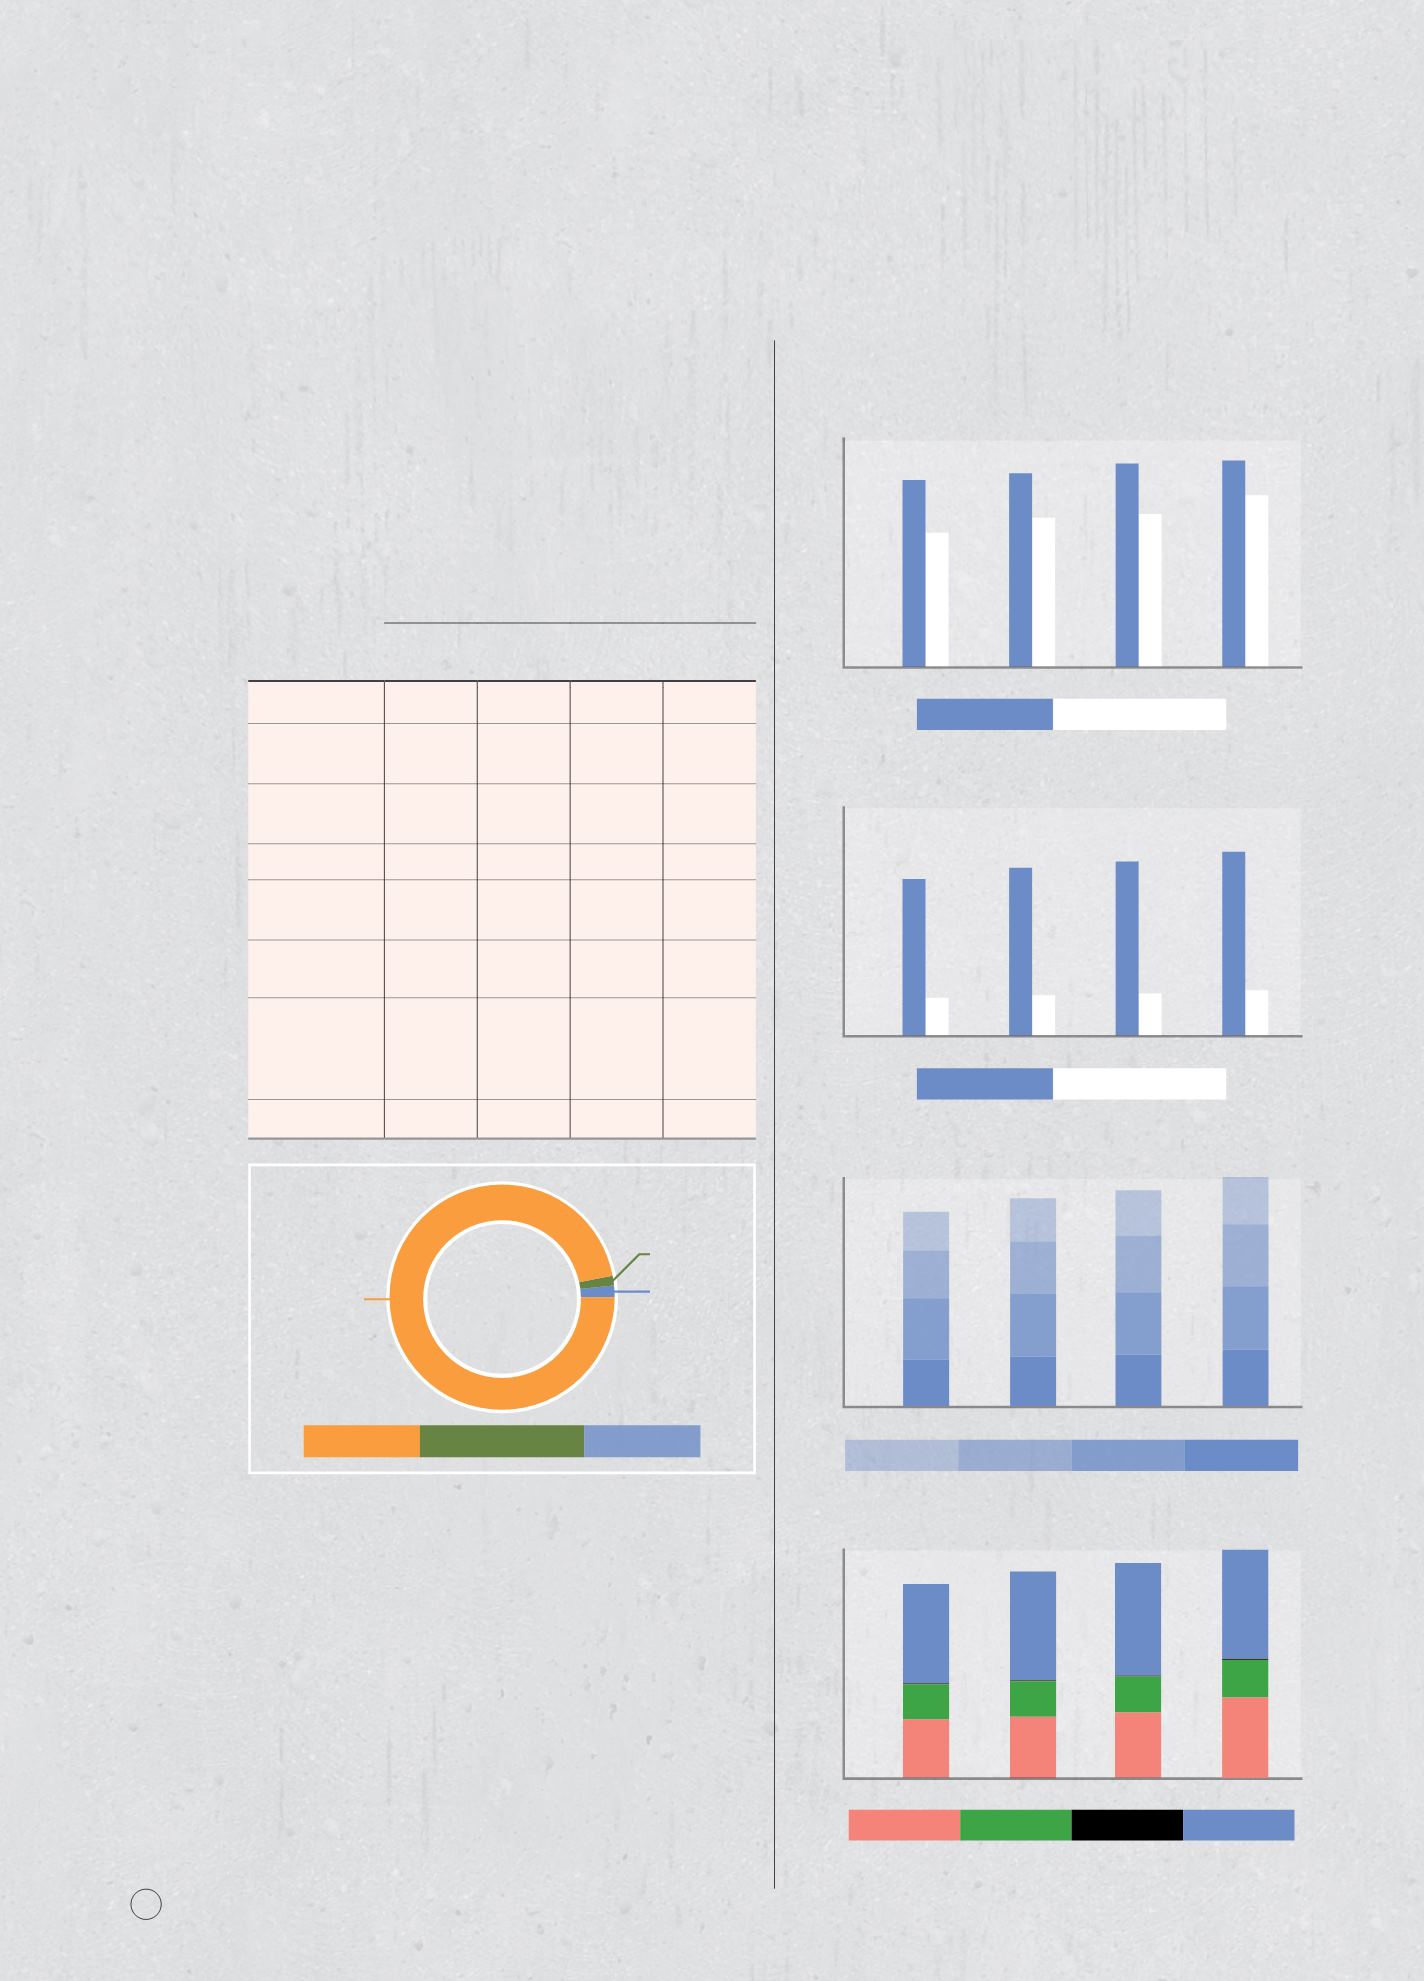
in CMS as 97% of employees hired in 2016 were from
Sarawak. If we are unable to recruit locally, other
Malaysians are considered before we look further afield.
Total Joining in 2016 (persons)
Company/
Division
Overall
Sarawak
West
Malaysia Expatriates
Cement
52
52
-
3
Construction &
Road Maintenance
171
171
-
-
Construction
Materials
17
17
-
-
Head Office
7
6
1
1
Services (CMS
Infra & TPS)
7
7
-
-
Financial Services
(OPUS)
3
-
3
-
Property
Development
& Samalaju
Properties
5
5
-
-
TOTAL
266
258
4
4
Diversity in the Workforce
Sarawak is famous for its multi-cultural and close-knit
society.With a variety of ethnic groups and at least 40 sub-
ethnic groups, each with its own distinct language, culture
and lifestyle, Sarawak is not only tolerant of diversity, but
embraces it. Being a home-grown company of the State,
we hope to embody the same spirit and perspectives
when it comes to supporting a diversified workforce. We
continue to drive a work culture that values the unique
perspectives and contributions of every employee, thus
ensuring that we attract and retain a talented workforce
that contributes to the Group’s success.
Social: Labour Practices and Decent Work
The following charts highlight the diversified workforce
at CMS.
Female
Male
0
500
2500
2000
1500
1000
1726
2013
2014
2015
2016
405
435
453
487
1840
1911
2023
Workforce by Gender
0
300
1,500
1,200
900
600
1,246
2013
2014
2015
2016
885
984
1,008
1,133
1,291
1,356
1,377
Non-permanent staff
Permanent staff
Workforce By Employment Type
Workforce by Age Group
0
500
2500
2000
1500
1000
2013
2014
2015
2016
510
665
530
426
474
575
684
542
564
683
617
500
520
679
695
616
<30
30-40
40-50
>50
Workforce by Ethnicity
Malay
Chinese
Indian
Others
0
500
2500
2000
1500
1000
2013
2014
2015
2016
883
414
1,201
716
676
641
388
1,091
390
1,198
397
1,240
11
11
11
12
Sarawakians West Malaysians
Expatriates
No. of
Employees
(persons)
97%
1.5% (4
)
1.5% (4)
(258)